




Website KPIs should show whether a site is attracting the right visitors, keeping them interested, and turning them into leads, sales, or subscribers. A strong KPI set starts with traffic quality, then checks engagement, then measures conversion performance. Vanity numbers alone create noise. A site can have 100,000 visits and still fail if visitors leave in seconds or never act.
TLDR: The most useful website KPIs are traffic sources, engaged sessions, bounce rate, conversion rate, revenue per visitor, and customer acquisition cost. For example, if a store gets 50,000 monthly visits, a 2% conversion rate, and a $70 average order value, it produces about $70,000 in revenue. If the same store raises conversion rate to 2.6%, revenue climbs to $91,000 without adding traffic. That is why KPI tracking should focus on business outcomes, not just more visitors.
Why Website KPIs Matter
Website KPIs help teams see what is working, what is weak, and what needs fixing first. They turn vague questions into clear answers. Is paid traffic profitable? Are blog readers becoming leads? Is checkout losing buyers? Without KPIs, teams guess. And guessing gets expensive fast.
The catch is that analytics tools can bury simple answers under too many tables, filters, and labels. A report that takes 40 extra seconds to load or needs five clicks to show conversions will not help a busy team. Good KPI tracking should stay focused, easy to read, and tied to goals.
Traffic KPIs: Measuring Visitor Volume and Quality
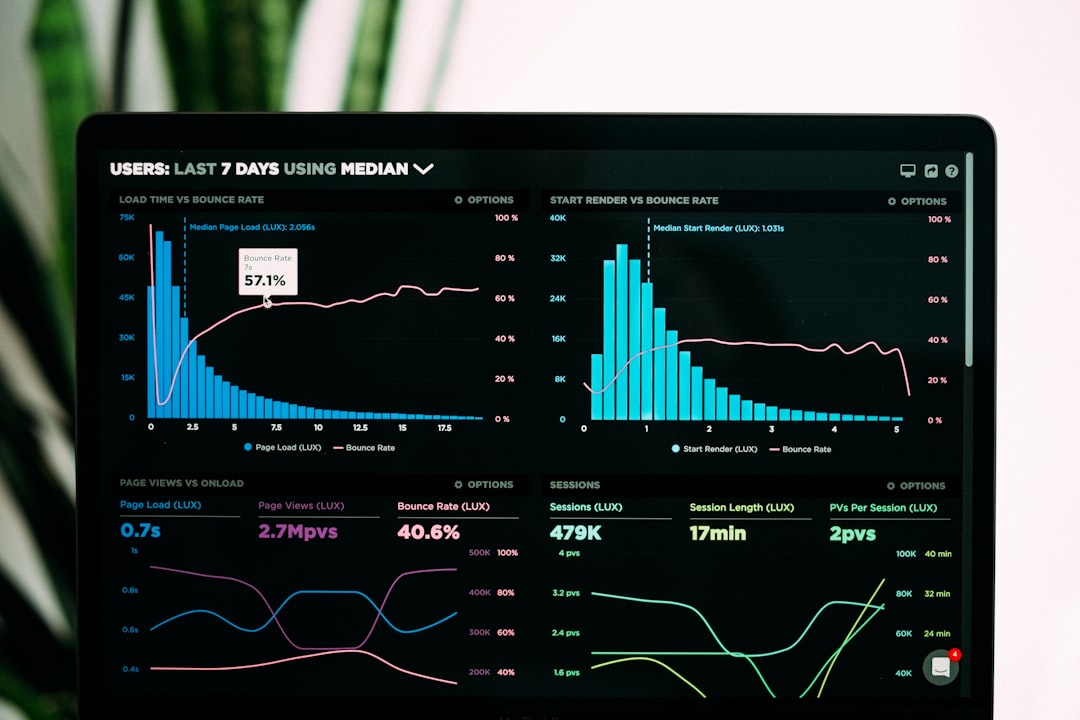
Traffic KPIs show how people find a website. They also reveal whether those visitors are worth chasing. More traffic is useful only when it brings the right audience.
- Users: The number of individual visitors during a set period. This shows audience size.
- Sessions: The number of visits. One user can create multiple sessions.
- Pageviews: The total number of pages loaded. This helps measure content demand.
- Traffic sources: The channels sending visitors, such as organic search, paid ads, email, social media, referrals, or direct visits.
- New vs. returning visitors: A useful measure of audience growth and loyalty.
Traffic source data often gives the first warning sign. If paid search brings 30% of visits but only 5% of conversions, the campaign may be attracting the wrong clicks. If organic search brings fewer visits but higher lead quality, content may deserve more budget.
Healthy traffic is not always the highest number. A B2B software site may prefer 8,000 targeted visits over 80,000 casual readers. Quality beats volume when the business goal is revenue.
Engagement KPIs: Measuring Visitor Interest
Engagement KPIs show whether visitors care once they arrive. They help teams spot weak pages, confusing content, slow load times, and poor calls to action.
- Engagement rate: The share of sessions with meaningful activity, such as scrolling, clicking, or staying long enough to count as engaged.
- Bounce rate: The share of sessions where visitors leave without meaningful interaction. A high rate can signal mismatch, poor speed, or weak content.
- Average engagement time: The average time visitors actively spend on the site.
- Pages per session: The average number of pages viewed in one visit.
- Scroll depth: How far visitors move down a page. This helps judge whether key content appears too low.
- Internal clicks: Clicks on menus, buttons, product cards, filters, and related links.
Engagement metrics need context. A short visit on a contact page may be fine if the visitor submits a form. A long visit on a pricing page may be bad if the visitor seems confused. Honestly, it feels like some reports try to make simple behavior look harder than it is. The best approach is to pair engagement KPIs with the page’s job.
For a blog post, strong engagement may mean long read time and newsletter signups. For a product page, it may mean clicks on images, size guides, reviews, and add to cart. For a help article, it may mean fast answers and fewer support tickets.
Conversion KPIs: Measuring Business Results
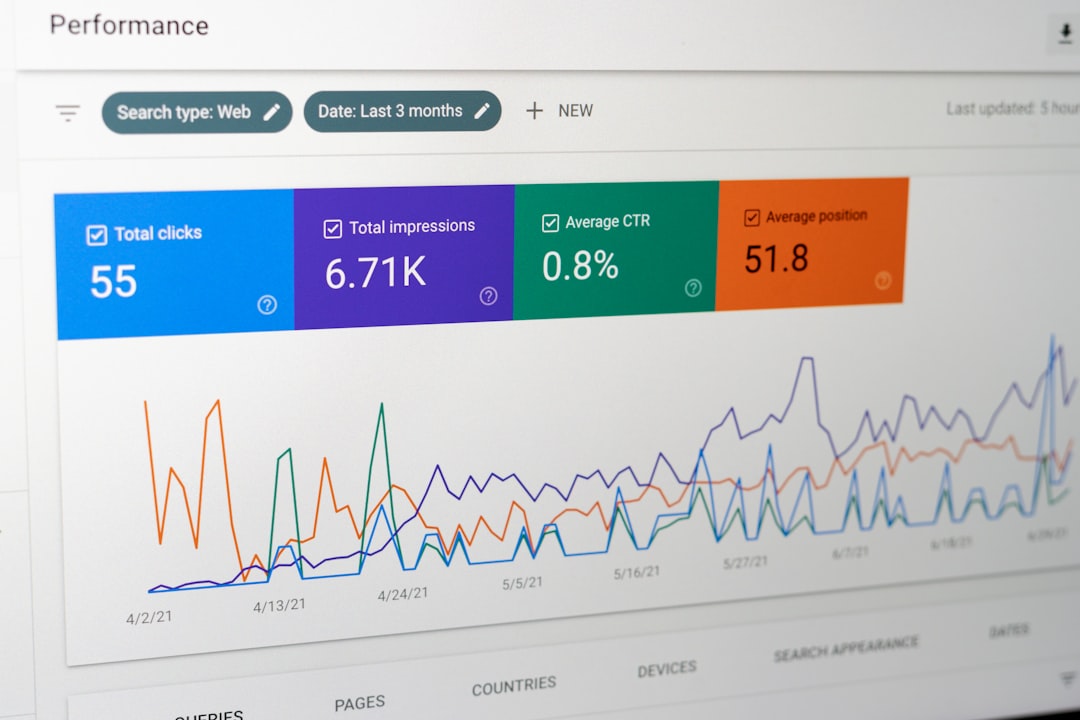
Conversion KPIs show whether the website produces value. A conversion can be a sale, lead form, demo request, booked call, account signup, app download, or email subscription.
- Conversion rate: The percentage of visitors or sessions that complete a target action.
- Goal completions: The total count of completed actions.
- Revenue: Total income from website transactions.
- Average order value: The average amount spent per order.
- Revenue per visitor: Total revenue divided by total visitors.
- Cost per acquisition: The average cost to gain one customer or lead.
- Cart abandonment rate: The share of shoppers who add items to cart but do not buy.
Conversion KPIs expose friction. If 1,000 visitors start checkout and only 420 finish, the site has a 58% checkout drop-off. That may point to surprise shipping costs, forced account creation, payment errors, or slow pages. Small fixes can carry large gains.
A service business may track form starts, form completions, phone clicks, and booked consultations. An ecommerce site may track add to cart, checkout start, payment completion, refund rate, and repeat purchase rate. Each business needs KPIs that match how it earns money.
Technical KPIs That Affect Performance
Technical KPIs are not just for developers. They shape traffic, engagement, and conversions. A slow site loses visitors before content has a chance to work.
- Page load time: How long a page takes to become usable.
- Core Web Vitals: Measures linked to loading speed, visual stability, and interaction delay.
- Mobile performance: How well the site works on phones and tablets.
- Error rate: Broken pages, failed forms, checkout errors, and server issues.
- Search visibility: Impressions, rankings, and click-through rate from search results.
If a page takes six seconds to load on mobile, traffic reports may hide the real problem. Visitors may leave before analytics records much behavior. Faster pages often improve engagement and paid ad efficiency at the same time.
How Teams Should Choose Website KPIs
A good KPI list is short. It should fit the site’s main goals. A lead generation site does not need the same KPI set as a media site or online store.
- Define the business goal: Sales, leads, subscriptions, bookings, or audience growth.
- Map the visitor path: Entry page, content, product view, form, checkout, or contact point.
- Select one main KPI: This could be conversion rate, revenue, qualified leads, or subscriber growth.
- Add support KPIs: Use traffic and engagement metrics to explain movement in the main KPI.
- Review trends weekly or monthly: One bad day should not cause panic. Ongoing patterns matter more.
For example, a SaaS company may choose demo requests as its main KPI. Support KPIs could include organic traffic, landing page engagement, form completion rate, and cost per qualified lead. If demo requests drop, the team can inspect each step instead of guessing.
Common KPI Mistakes
Many teams track too much. That creates clutter and slows decisions. A dashboard with 40 charts may look impressive, but it often hides the answer.
- Chasing pageviews without measuring outcomes: High traffic means little if no one converts.
- Ignoring channel quality: Not all visits have equal value.
- Comparing unlike pages: A blog post, home page, and checkout page have different jobs.
- Using averages only: Segmenting by device, channel, and location often reveals the real issue.
- Failing to tag campaigns: Poor tracking makes reports messy and hard to trust.
The best website KPI reporting connects cause and effect. Traffic explains reach. Engagement explains interest. Conversions explain value. When all three are tracked together, teams can make sharper decisions and avoid wasting budget on empty growth.
FAQ
What are website KPIs?
Website KPIs are measurable indicators that show how well a website supports business goals. Common examples include traffic, engagement rate, conversion rate, revenue, and cost per lead.
Which website KPI is most important?
The most important KPI depends on the site goal. An ecommerce site often focuses on revenue and conversion rate. A service site may focus on qualified leads or booked calls.
How often should website KPIs be reviewed?
Most teams should review key metrics weekly and study deeper trends monthly. Daily checks can help during campaigns, launches, or technical issues.
Is bounce rate still useful?
Yes, but it needs context. A high bounce rate can signal poor fit or weak pages. On simple answer pages, it may not always mean failure.
How many KPIs should a website dashboard include?
A practical dashboard often has 8 to 12 core KPIs. This is enough to cover traffic, engagement, conversions, and technical health without creating clutter.