In today’s fast-paced digital environment, executives need reliable, real-time insights into the health and performance of their company’s digital assets—especially websites. The importance of site health has never been greater, given the increasing reliance on online platforms for business operations, marketing, customer service, and revenue generation. Traditional manual reporting methods are no longer sufficient to address the evolving demands of business leadership. This is where automated site health dashboards come into play.
What Are Automated Site Health Dashboards?
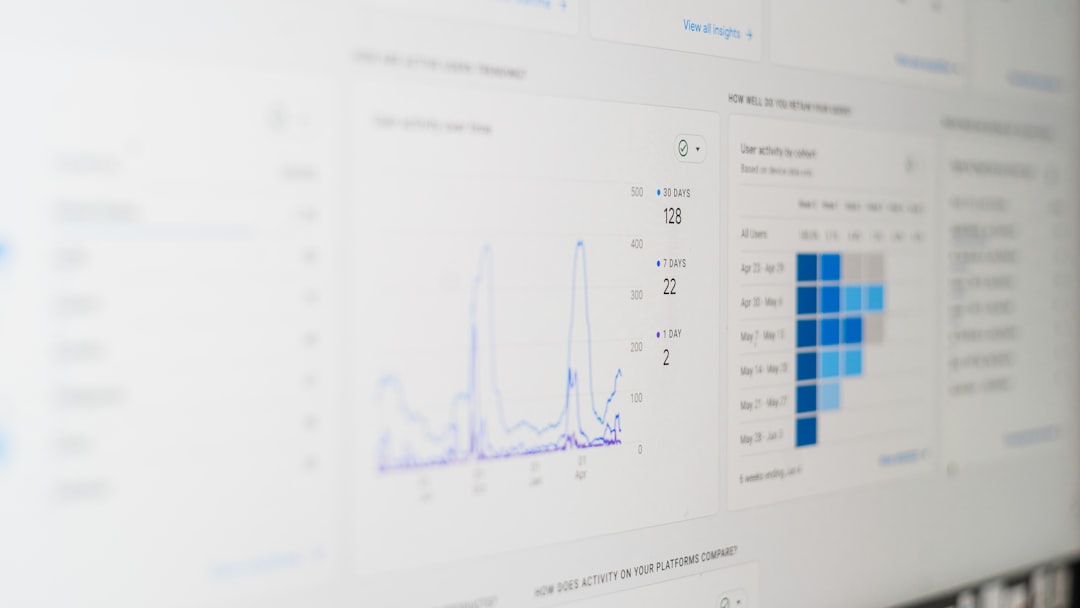
Automated site health dashboards are real-time reporting tools that provide a visual representation of key metrics related to website performance, security, traffic, uptime, and more. These dashboards pull data from various sources—like monitoring tools, analytics platforms, and content management systems—to offer a centralized, accessible interface tailored for quick insights.
For executives, the value lies in the high-level overview that these systems provide. Rather than diving into technical reports or interpreting dense spreadsheets, business leaders can glance at a dashboard and instantly understand how their digital properties are performing.

Why Executives Need Site Health Dashboards
Executives often wear many hats, juggling business strategy, investor relations, marketing oversight, and risk management. Time is a scarce resource. In such a landscape, automated dashboards offer several tangible benefits:
- Real-Time Monitoring: Instant visibility into critical metrics helps in proactive decision-making and prevents small issues from escalating.
- Data Consolidation: No more switching between Google Analytics, server logs, CMS platforms, or social listening tools—everything is in one place.
- Customizable Views: Dashboards can be configured to display only the most relevant KPIs, ensuring that the information is both concise and targeted to organizational goals.
- Improved Communication: Sharing automated reports with stakeholders becomes easy, reducing friction in team collaboration and board presentations.
Key Metrics to Monitor
Not all metrics are equally valuable to executives. A well-designed dashboard should focus on indicators that align with business objectives and digital strategy. Below are some of the most vital components:
1. Performance Metrics
- Page Load Time: Long load times can lead to user frustration and increased bounce rates.
- Mobile Responsiveness: With mobile traffic overtaking desktop, this is more important than ever.
- Server Response Time: A direct indicator of your back-end infrastructure’s health and efficiency.
2. Traffic Insights
- Unique Visitors: A snapshot of brand reach and audience engagement.
- Geographic Distribution: Helps to fine-tune marketing targeting and localization efforts.
- Referral Sources: Shows which campaigns or channels are driving the most traffic.
3. Security Indicators
- Downtime Alerts: Immediate notifications for server failures or security breaches.
- SSL Certificate Status: Ensures encrypted, secure user sessions.
- Vulnerability Scanning: Proactive risk detection and management through daily scans.
4. SEO and Content Health
- 404 Errors: A high count of broken links affects user experience and search rankings.
- Indexing Status: Ensures that your web content is discoverable by search engines.
- Top Performing Pages: Knowing what is working helps replicate success elsewhere.
Technology Behind the Dashboards
Creating effective site health dashboards involves integrating multiple tools and data sources. Leading solutions often combine:
- APIs: Connecting with services like Google Analytics, SEMrush, and Pingdom.
- Cloud Computing: For scalable storage and fast data processing.
- Artificial Intelligence: Offering predictive analytics and anomaly detection.
- Data Visualization Libraries: Tools like D3.js and Chart.js are commonly used to build intuitive visuals.
Moreover, platforms like Power BI, Tableau, and Google Data Studio have made it easier than ever to build such dashboards without deep programming knowledge.

Executive-Friendly Design Principles
Because executives are not typically technical users, designing dashboards for this audience requires a special approach. Consider the following design principles:
- Clarity Over Complexity: Avoid data overload. Use clean layouts and clear labeling.
- Hierarchical Data: Start with the high-level overview, and make it easy to drill down for details.
- Visual Coding: Use color-coding and visual symbols to indicate alerts, trends, and statuses.
- Mobile Compatibility: Many executives check dashboards on-the-go; responsive design is crucial.
Use Cases Across Sectors
Automated site health dashboards are not limited to tech companies. Executives across a broad spectrum of industries are embracing them:
- E-Commerce: Monitor cart abandonment rates, traffic surges during campaigns, and backend load issues.
- Healthcare: Ensure secure data management, uptime of patient portals, and compliance with data protection regulations.
- Finance: Real-time fraud detection and website encryption status validation.
- Education: Track student portal activity, course content performance, and traffic trends.
Challenges and Considerations
While these dashboards are powerful tools, they come with their own set of challenges:
- Data Accuracy: Garbage in, garbage out; feeding poor-quality data into the dashboard undermines its utility.
- Security Risks: Centralizing sensitive site data in one location requires robust access controls.
- Cost of Implementation: Upfront investment in tools and integration might be high for some organizations.
- Change Management: Getting leadership buy-in and adjusting regular workflows can take time.
Future Trends
The future of automated dashboards is promising. Advancements in AI and machine learning are paving the way for even smarter reporting tools:
- Predictive Analytics: Spotting trends before they become problems will become more accurate with AI integration.
- Natural Language Processing: Executives will soon be able to ask questions—like “Why did traffic dip this week?”—and get answers in plain English.
- Voice Command Capabilities: Think Alexa or Siri for business reporting.
These features will continue to make dashboards more interactive, accessible, and valuable for executive decision-making.
Conclusion
In an age where your digital presence is as critical as your physical operations, executives can no longer afford to wait for monthly IT reports to understand how their websites are doing. Automated site health dashboards transform data into decision-making power, offering fast, reliable, and business-friendly insights.
By aggregating performance indicators, traffic data, security metrics, and SEO health into a single interface, these systems empower leaders to act with confidence and clarity. As technology continues to evolve, the integration of smart features will make these dashboards even more indispensable.
Ultimately, organizations that invest in quality dashboard solutions are not only enhancing their digital resilience but also giving their leadership a strategic edge in a competitive market landscape.


